Case Studies / Toshiba

Factory Management with IoT
Visualising Production Metrics to Improve Output
Toshiba Machine Company Ltd manufactures a wide range of equipment such as injection molding machines, extrusion molding machines, fine transfer devices, precision instruments, machine tools, electronic control devices, and industrial robots. Its products are used in a wide range of fields, including automobiles, electronics, optics and nanotechnology, and it has the top market share globally for sales of die casting machines.
Facing fierce global competition, Toshiba has been investigating new ways to add value across its production facilities and differentiate itself from rival manufacturers. One of Toshiba's priorities has been an IoT (Internet of Things) initiative.
As Mr. Hiroyuki Maehara, of the company's Technical Systems Control Division, said: “we have been developing a machine tool IoT utilization solution called ‘IoT + m platform’. This solution attempts to implement a ‘smart factory’ by helping to detect sudden failures in order to achieve zero downtime, as well as visualise the state of both our new and existing equipment”.

Visualising Production Information Supported by IoT
Although Toshiba in future intends to sell the “IoT + m” platform to other industries, up to now its main focus has been on demonstrating the capability at an internal factory.
“We operate long life, large scale mechanical products in our own plant,” says Maehara, “and we can collect abundant samples for preventative maintenance”. These samples include data from various sensors such as temperature, humidity, and vibration.
While Toshiba's solution monitored the data from these sensors in real time, the missing link was a mechanism for visualising the results.
Initially, the company made the data available as KPIs in Excel spreadsheets, but this made it difficult to see a true cross-section of the production information across the factory. As a result, not everyone had a common understanding of the current status and any preventative action that might need to be taken was being delayed. Further, secondary information collected by the line managers was scattered across the company in various Excel documents, leading to delays collating information and the creation of multiple similar reports by different areas of the business.
Toshiba needed a BI tool for visualising the outcomes of the IoT project, and for that it turned to MotionBoard.

Four Become One: from Excel to Business Intelligence
One of the key drivers behind selecting MotionBoard was that Toshiba wanted a BI solution that would be used across the whole business, not just by a specialist analytics team. MotionBoard was already in use by Toshiba’s information systems department where it was used to visualise management information. Having proven itself in-house, it quickly emerged as the top candidate.
Another advantage was the existing Excel documents could be used as input to the dashboards, allowing for the information that was currently tracked through several spreadsheets to be integrated into a single screen, accessible to all.
As a result, in 2017 Toshiba expanded MotionBoard to a company-wide BI platform and began developing dashboards.
The new screens allowed decision makers to understand the overall production status in real time, with a colour coded view of the progress rate for each part: blue (running smoothly), yellow (requires attention) or red (delayed). This allowed for prompt action to be taken to rectify any issues. The dashboards also allowed users to drill down to each individual machine to check the load status, daily operation results and the schedule.
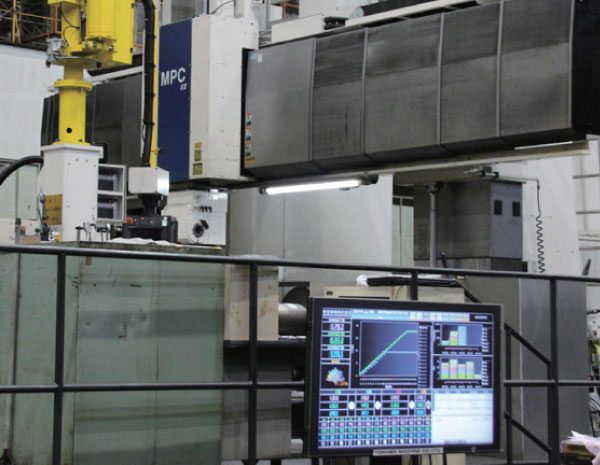
In addition, Toshiba installed a large display in a prominent location in the office. This shows the production status of the entire material processing division, including operational plans and the actual results, as well as quality costs and the number of defects, all visualised through MotionBoard.
“This dashboard displays production results and progress by line in real time. This has given rise to a competitive spirit for each team. More than ever before, we have seen improvements on-the-ground, with everyone working together to improve productivity.”
The new approach to Business Intelligence not only allows for real-time detection of anomalies, but also for the monitoring of longer term trends. The net result, is that machine downtime has been reduced by more than half. Mr. Ryuji Aono, Managing Director of Technology Planning, said: “This is a revolutionary improvement in quality and productivity even when viewed company-wide. MotionBoard was easy to introduce without major changes to our infrastructure and it allows us to intuitively visualise our data on site.”
Before
Production data was managed using Excel, but it was difficult to see a company-wide view of the data, and the information was scattered across the organisation.
Finding the necessary information to create reports was time consuming and inefficient.
After
Data that was spread across multiple documents is now consolidated into a single MotionBoard dashboard that anyone can operate and understand intuitively.
Toshiba can now understand the production conditions in real time, which has driven a culture of competition between teams, who are striving to improve quality and productivity.
