Start Trial
After you submit this form, one of our representatives will be in touch to discuss your corporate needs and organise a limited period trial of our products, if suitable. We won’t share your details and you can opt out of communications from us at any time.
Webinar Transcript
Matt Armstrong, WingArc Australia: Hello! Welcome! Thank you for joining me, my name is Matt Armstrong, I'm from WingArc Australia, and today I'm going to be talking through our self-service data platform SuperWeb2, which you can use to share your data with just about any audience that you need to reach.
So, this presentation is for you if you have data that you need to share, whether that's within your organisation, with other agencies, or even with the general public.
Matt Armstrong, WingArc Australia: But first, I wanted to talk a little bit about WingArc. So, we're a software company, we were originally founded back in the 1980s at Melbourne University. Used to be known as Space-Time Research, so if you've been in the government data world for a while you may have heard that name (we changed to WingArc Australia a few years ago). And we've been working with big data really since before big data was a thing.
So, we make tools for processing, publishing, and analysing large data sets, and our particular focus is on confidentiality. So
I'll talk a little bit later on about how we've helped various organisations around the world to open up their datasets while protecting the privacy of the individuals in that data. Because it can be very difficult when you've got something that's in any way sensitive to strike that balance between opening it up enough so that it's useful while also protecting the individuals inside that data, but our solution is really kind of a best of both worlds... to kind of solve that that problem.
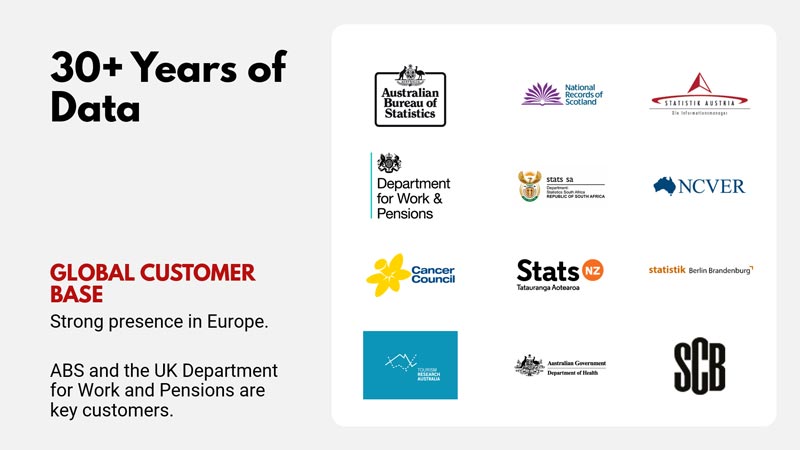
Matt Armstrong, WingArc Australia: We've got over 30 years' experience helping government agencies all around the world to share their data. You can see some of our customers on the slide here. Here in Australia, for example, our software is used by the likes of the Australian Bureau of Statistics. They use our tools to publish the Australian census data, so if you've ever been on their site and tried the Table Builder product, then you've used our software. But we also have customers all over the world. Strong presence in Europe, for example. In the UK one of our biggest customers there is the Department for Work and Pensions, which is kind of the UK equivalent of Centrelink. And they use our solution to publish many, many, millions of records of data on their various welfare payments, so that's things like disability benefits, unemployment benefits, pensions, that sort of thing.
And they're generally held up as a real success story for open data in the UK, and we play a really large part in making that happen.
You'll notice there's a number of other customers here ranging from agencies like Tourism Research, who provide survey and movement data to the tourism industry, and NCVER, who do vocational data across Australia on vocational training. And then there's national statistics agencies, like the National Records of Scotland, Statistics Austria, Sweden, even South Africa who are a really big user of our products sharing their data with the people of South Africa.
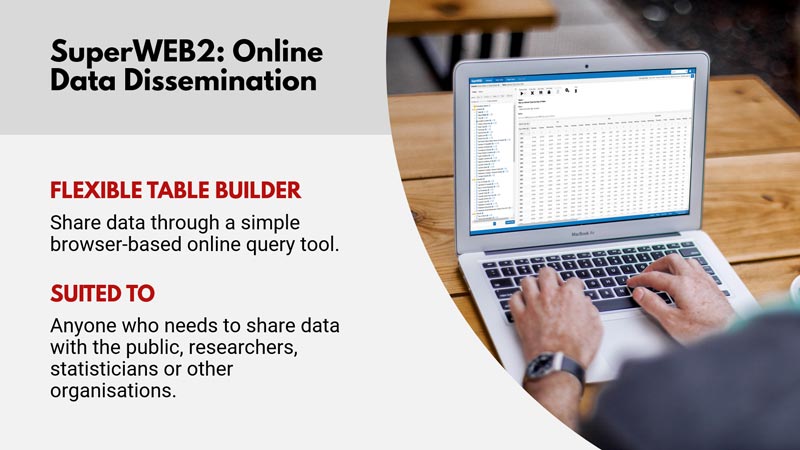
Matt Armstrong, WingArc Australia: So the main component of our solution that I'm going to be talking about today is SuperWEB2. We also have various tools that you would use within your organisation for working with your data, but SuperWEB2 is the kind of front-end to the solution, so that's what your users will see. And one of the key points about that is that it runs just in a web browser for the end user, so they don't need to install any software, they just use the web browser that they already have. And that means that if you need to share data with audiences like people in other agencies, across the organization... there's no kind of requirement to get them to you know go through the process of getting software installed, because it's just the web browser that they already have. Everyone with just a login can get started and start working with your data.
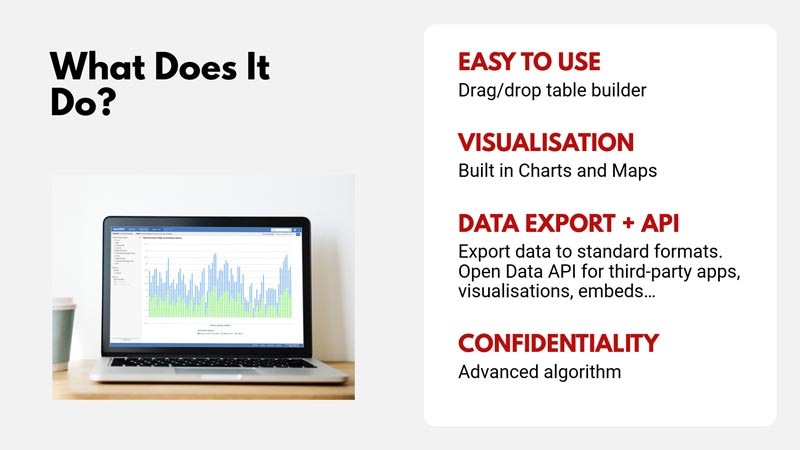
Matt Armstrong, WingArc Australia: So SuperWEB2 is a drag and drop table builder tool, where your users can ask just about any question they they like of your data. So gone are the days of having to provide fixed table outputs that you know specific queries that you think people might be interested in, with our solution you can let them build whatever they want essentially, but crucially you don't have to give out the underlying unit records. The tabulations all happen on-the-fly in our tool, and then they get the aggregated results that they're interested in.
We've also got extensive visualization capability, so once someone's built the table they can easily flick across and create a chart, create a map, and we have an API as well. So for those that don't know, an API is just a tool that allows people to write code that pulls data from your system. So that means people can do things like build their own visualisations, build infographics... all pulling data directly from your single source of truth. They could even build their own third-party applications powered by your
data, and if your data changes then that automatically flows through to the application.
The other important point is our confidentiality solution. So I'll talk a little bit about more about that a little bit later on, but we've got some special technology for protecting the identity of the individuals in your data, if that's important to you.
So I'm going to switch over now and show you a bit of the of the SuperWEB2 tool.
But before I do that, I wanted to talk a little bit about about open data. Over the last decade or so, we've seen this huge rise in data being published by organisations. There's been this recognition that there's real value in government data and that sharing it with the public has all sorts of benefits. But when you look at the sites where the data is being released, often there's two kind of categories of data that gets released: it's either pre-aggregated, it goes out as Excel or sometimes even PDF, which is obviously better than nothing, but it doesn't give that kind of flexibility for people to build interesting things with it. The other category is unit record data does sometimes get released but it's often just a dump of CSV files or Excel files, so there's kind of drawbacks to both of those approaches. As I say, the aggregated data obviously only answers the specific questions powered by the specific combination of variables that are in the aggregation, but on the other hand the unit record data is really flexible, but obviously limited in terms of what type of data you can release in that format. So anything remotely sensitive just cannot go out as a CSV (and sometimes, as I'll refer to later, sometimes data is released in CSV and really shouldn't be).
That's another issue often with opening up. There's also an issue of kind of barrier to entry as well with this stuff. If you're publishing data as CSV files, that's really targeting a specific subset of people who can actually do something with that data. It's people who have access to databases, you know, the right kind of data science skills to work with it. It doesn't necessarily open it so much to a more general audience. So we think that this kind of interactive self-service approach of our solution is a better way to do. Anyone can access the data. We've kind of lowered the barrier of entry. You just need a web browser, not specialist tools. It also means people can choose their own combinations of variables quite easily, not just the ones that you've actually published, the specific combinations. And finally, our solution opens up the possibility of flexible access to sensitive data, without compromising confidentiality.
So let's dive in and take a bit of look at SuperWEB2. So what I'm showing you here is our public demo site. You can go and have a look at this for yourself, it's on our website. And here we've collected various data sets that just give you an idea of how the solution works. So on the left here, you've got some available data and on the right there's an area that's really flexible for you as the publisher. You can put whatever you like here. In this example, I've put some information about about the available data. So, for example, let's drill down into one of these. So I've got some open data sets from the UK here. So let's have a look at this road accident one... You can see as I click through there's some more information about the data here on the right, and I've embedded some some headline charts using our API. And in the middle here, you can see there's all the saved tables, or saved queries I guess. So these can be queries that are either saved by the publisher of the data, but it's also possible for users to save their own queries so that they'll be there waiting for them when they come back.
And as you can see as I click through that one, it's running the tabulation there. That's done on the fly when you reload the query, so if this is a dataset that's being updated regularly, then that will get the latest data. It's only saving the structure of the query, not the actual data itself. So I started with a saved table, now if that's one that was built by the administrator that published the data then that's a bit like the old scenario where you would publish pre-saved queries in Excel or whatever, except the difference here is that I can go in and change that. So let's say actually I'm interested in these variables but I want to make a slight change, I can do that. I can start with the table that's been provided, and make my own table. So for example, if I expand the field list over here, I can pull in other variables. Let's say I want to make this filter down to a specific location. So I can drag in the location variable here, drop it onto the rows, and re-run the tabulation. And now I can see the breakdown by geography, and you'll see that it's nested that field, along with the year, so the table's giving me Accidents by Vehicle Type, in that year and for that region. And the cool thing here is that, let's say I want to drill down into that location in a bit more detail, so this field's been modelled in our system as a hierarchy, so all I need to do is just click on the name there, and it'll drill down to the next level. And I can keep going down through the hierarchy. Maybe, actually, I don't want to see it by year, so all I need to do is just drag that... I can drag that item up, we can put it on the wafers for example. That's kind of another dimension to the table that we have, so that'll give me a kind of a three-dimensional table. I'm just looking at one sort of slice of that table at the moment.
Maybe I don't want it at all, so I can just drag it away and drop it onto the trashcan icon like this. And it's gone from my table.
And I can keep making changes to the table to get exactly what I want, so it's really that simple, it's just drag, drop, and explore. And as I mentioned we've got some basic visualizations that you can easily switch to, so Graph View gives me a bunch of chart types to choose from, and there's some interactivity here, so I can filter out by the items in the legend here. Let's say I want to take out cars, I can just click on that and the chart will update automatically. We've also got our Map View component, when you've got geographic data that is in your table. So it'll draw that out on one of the maps, and that's all done on the fly. It stitches together the underlying data from your table and the regions to produce the map. And one of the cool things I can do here on the map is, let's say, on this one I've got a few regions selected there, but perhaps I want to add these adjoining regions down here. So I can just draw out a zone on the map, and it will pick up all the boundaries in my data set for this geography that are within that zone that I've drawn, and it'll add them to both the map here, and also they get added onto the table. And that's basically the solution in a nutshell. So really simple to use, just drag and drop, explore the data, you can drill up and drill down through the hierarchies, select classifications from the fields you're interested in, you can even do simple calculations within the table to create custom variables, your own synthetic variables.
One of the other things I'll just mention quickly is our metadata support so if you want to explain your data to your users, you can include extensive descriptions and metadata. For example, we've got these little info icons in this dataset. I can click on one of those and I'll get the the extra information about that field. For example, this one here shows me some more detail about how they determine where, when an accident happened on an intersection, which road exactly was it categorized under. We can also do inline annotations as well, so these are really useful if you've got some oddities in your data. Maybe there's something unusual about how the data was collected, something that you really need to put front and centre when someone's looking at the data so that they don't misinterpret that data. And those those all show up down the bottom of the table here.
One other thing that I'll mention here is our data export feature, so once you've built the table you can export out to a variety of formats like Excel, CSV, and you can also export your charts and maps as images. And then finally we've got our API, which I mentioned earlier. So that allows people to do whatever they want with your data, essentially, to build interesting things using your data as the source for that. Some examples here: this is another of our demos, we're showing some example visualizations, kind of infographic concept, and that's all automatically pulling that data from our system using the API.
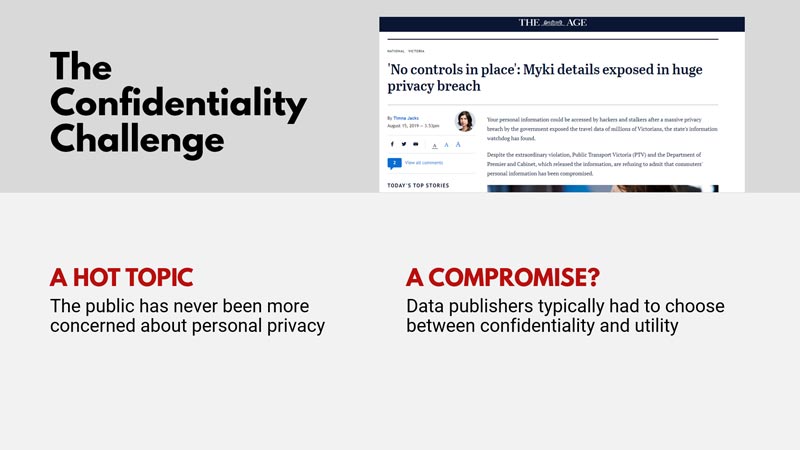
Matt Armstrong, WingArc Australia: So the final topic I'd like to talk about is confidentiality. As ever, this is a hot topic amongst the public. There's an increasing kind of awareness of the importance of privacy, and as publishers of data, we need to not only do the right thing, but also be seen to be doing the right thing as well so that people will trust that we're treating their data properly. There's an example here of some data that was released by Melbourne's public transport smart card system, Myki a couple of years ago, that was shared by Public Transport Victoria for a data hacking event, and they'd taken out all the personal data, the names and so on, but it turned out it was pretty trivial to actually link that up with known data from other sources to identify people in the dataset.
So that's really the heart of the issue with confidentiality: if you know someone's in a dataset, you know some other stuff about them, you can quite often bring those two together to identify that person and then once you've found them, you can then use that to go on and find other stuff about them you didn't already know. So the example with the Myki data, the researchers that highlighted the problem were able to take the Twitter account of a State Member of Parliament and they linked up some of the information he posted in his tweets on the internet with a record in the dataset, and they were able to find him, and then find all his other travel history from that period.
And they also said that it was possible to find someone, if you'd travelled with someone on a train, even just once, you could often then find that person in the data. That could be an acquaintance, a colleague, someone you went on a date with once, for example. If you just knew that little bit of information about them, you could then find their entire travel history in the dataset. So traditionally, this risk has meant compromises.
That's meant well, how much of the data do you have to remove to protect people? And does taking all that out mean it's less useful, because you have to generalize to such an extent.
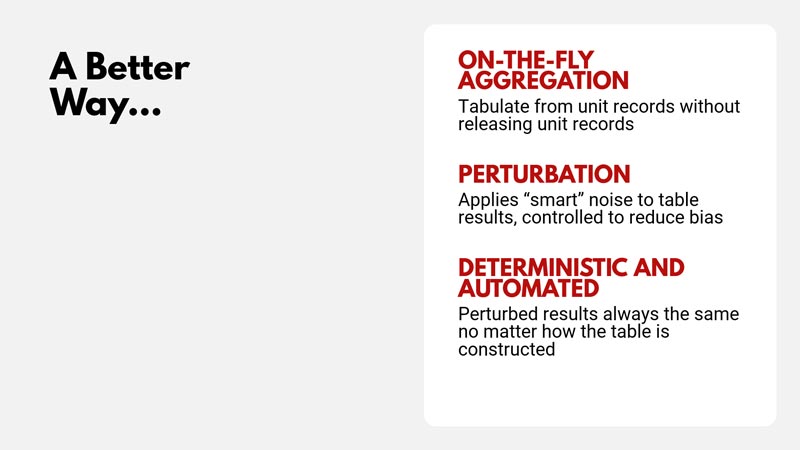
Matt Armstrong, WingArc Australia: Our approach is a little bit different, and we think it's a pretty unique solution to the problem. The first thing to note is that, as I've shown you, we don't require you to give out the unit records. People can build their own aggregations based on your data, but all the aggregation happens on the server. They just get the end results. So you're giving that flexibility, without giving away the underlying data. And the other thing we have is something called cell-key perturbation, which is applied, if you choose to use this part of our solution, applied to the data... every cell in the table gets a little adjustment, which is not enough to change the overall pattern, and you can control for bias and there's a whole bunch of configuration around this that you can do to make it work the way you want it to, but it's enough that you then can't actually identify individuals in that data. So it's fully automated, deterministic - so that means if you make the same table twice, or even the same combination of fields twice, you get the same perturbed result.
If someone else makes that table, they get the same perturbed results, so everyone gets the same end results. They're slightly different to the true numbers but they're adjusted just enough so that you can't actually find people in the data. We originally developed this with the Australian Bureau of Statistics, and they've been using it for the Australian census for many years now, and a lot of our customers around the world use it as well. And that's really helping them release data that they wouldn't otherwise be able to publish, and that's really beneficial to the community, to get that data out there that otherwise would just be locked up.
So that brings me to the end of the presentation. I hope you found it useful.
Do check out our website, wingarc.com.au. You can head there, you can find our demo site, which you can have a play with, some information about the API. If you've got any questions, please do get in touch. If you have data that you need to share, let me know and we can see how we can help.
Thank you very much for your time.
