Retail heat maps are a powerful tool for helping bricks and mortar retailers to understand in-store shopper activity, but what are they, and how do they work?
Essentially, a heat map is a type of data visualisation that uses colour and shading to represent the magnitude of the underlying information.
In the retail context, we're usually talking about spatial heat maps. That means that the base of the visualisation is an image of the physical store layout, most likely a floor plan, and coloured data points of varying intensity are then applied on top of this to show where activity in the store is taking place.
With a retail heat map, store management can see at-a-glance which areas of the store are busiest and which are quietest, as well as identify any bottlenecks and look at patterns at different times of the day.
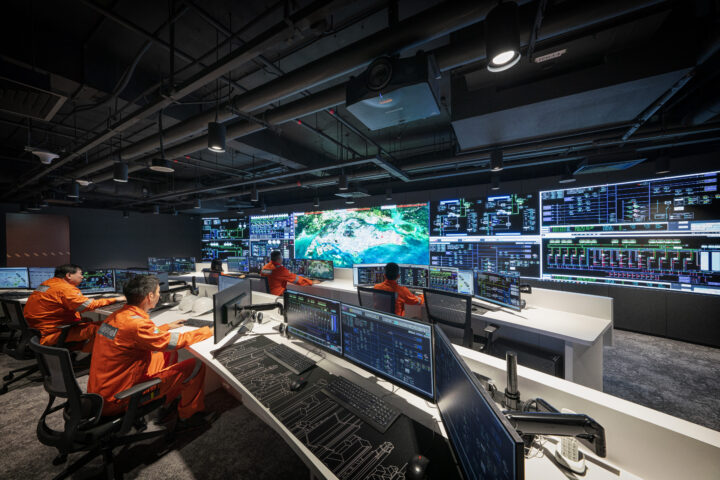
Typically the data would be collected using sensors or cameras within the physical store that can track activity and generate the data needed to display the heat map within the analytics dashboard. For example, WingArc's Retail Analytics platform uses the store's existing security camera infrastructure to track customer activity and generate comprehensive heat maps.
What are the Advantages of Heat Maps?
Retail heat maps provide many opportunities for retailers to gain insights into in-store activity and customer behaviour.
For example, information about the busiest areas of the store can drive your store layout decision making to maximise potential revenue, as well as validate the success, or otherwise, of in-store marketing. Did that new display catch shoppers' attention and cause them to dwell longer in that area? With a heat map, you can find out.
Another area where heat maps can provide valuable data to support your business is your suppliers over the placement of their items in your store. Heat maps give you concrete data to substantiate any claims you might make about which areas of the store attract the most foot traffic.
Heat maps can also highlight bottlenecks at checkout that might be leading to lost sales, as well as showing you times of day when your stores are busiest. If there are time-specific patterns in your customer data, you can tap into this when planning in-store promotional activity.
Heat Maps in Practice

WingArc Retail Analytics uses the video feed from your existing security cameras to track in-store activity. With this powerful capability, you can take a deep dive into what's going on inside your store.
For example, you can see all of your store traffic for an entire month, drill down to specific times of day, compare time periods, and much more.
Want To Know More?
Explore WingArc Retail Analytics to understand how our analytics platform and advanced heat mapping technology can help you understand your customers, reduce costs, and measure your marketing.