As Melbourne enters another week of its second stage 3 lockdown, we take a look at some of the public data that shows the dramatic effect these lockdowns have had on the movement of people around the city.
The City of Melbourne has 54 automated pedestrian sensors located across the city, and releases the data from these sensors through the Melbourne open data portal.
Looking at the data for the whole of Melbourne across 2019 and 2020, you don't have to look too hard to spot the impact of the first lockdown:
Retail vs Transit: A Tale of Two Cities?
Digging a little further into the data, the charts below show 2020’s pedestrian numbers against the previous three years. Once again, it’s not hard to see which line is 2020.
Prior to lockdown 2.0, pedestrian numbers were slowly starting to recover in Melbourne’s prime retail locations, such as the Bourke Street Mall and Melbourne Central shopping centre. While numbers were still way down on usual pedestrian levels, from a low of around 200,000 pedestrians passing through Bourke Street in April 2020, numbers had recovered to around 650,000 in each location in June.
Melbourne’s major train stations (Flinders Street and Southern Cross), however, have remained largely flat, even after the initial lockdown measures eased, suggesting that the government advice to work from home if you can continues to be heeded by most businesses operating in Melbourne’s CBD.
Lockdown 2.0 Mobility Data
Other data sources also tell the story of Melbourne's ongoing lockdown situation. Social media giant Facebook has begun publishing mobility data that shows how much people are moving around compared to a baseline period (in February) that predates most social distancing measures.
Looking at the data for June and July by state tells the story. With virtually no cases, and restrictions beginning to relax, Queensland has seen people movements back to and even above its pre-COVID baseline.
Victoria on the other hand shows big drops after Wednesday 1st July, when the initial second wave lockdown came into effect for specific postcodes, followed by a huge drop after Wednesday 8th July when the lockdown was extended across the whole of metro Melbourne.
That said, after the initial plunge reached its lowest point on Sunday 12th July, activity started to creep back up the following week. Thankfully, it seems to be trending downwards again from Friday 17th, when Victoria announced a record 428 new daily cases of the virus. It will be interesting to see how this pattern develops as the lockdown continues. Will the people of Melbourne keep doing the right thing through another lengthy lockdown?
The situation in New South Wales over the same period also tells a story, with mobility levels almost back to baseline levels as of Sunday 19th July. With cases on the rise in NSW, albeit at much lower numbers than Victoria, it is to be hoped that increased activity in the state doesn’t lead to that outbreak getting out of control.
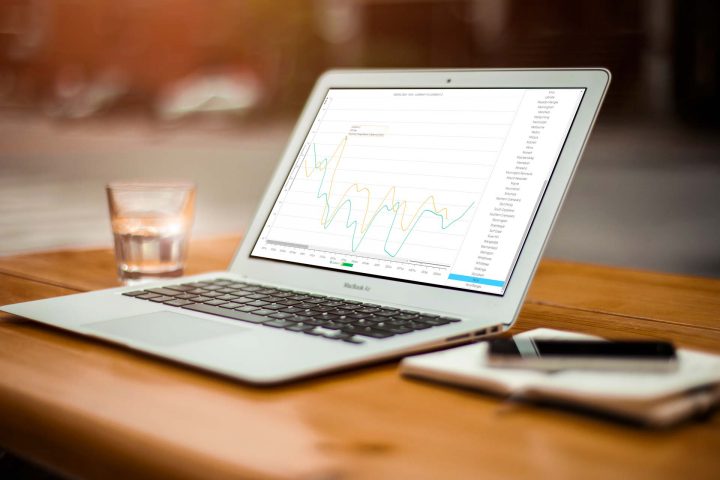
Of course, the lockdown measures don’t affect all of Victoria equally, with much more relaxed rules outside the Melbourne metro area. You can click the button below and use the list on the right to select and compare movement patterns within specific regions of Victoria.


