As Australia struggles to get to grips with its second wave of COVID-19 cases, what's different about this wave?
Tag: Visualisation
Victoria: (Not) On The Move
As Melbourne enters another week of its second stage 3 lockdown, how have people's movements changed?
COVID-19 By The Numbers
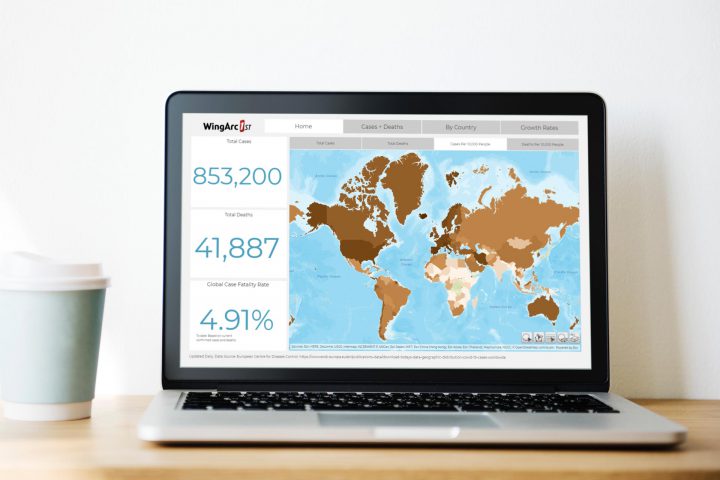
We've built an interactive MotionBoard dashboard to track the COVID-19 pandemic as this ongoing health emergency develops around the world.
Tackling Big Football with Big Data
One of the great things about having a sophisticated data analytics tool at your disposal, is that you can analyse just about anything. If it can be counted or measured in some way, then our software can consume your data...


