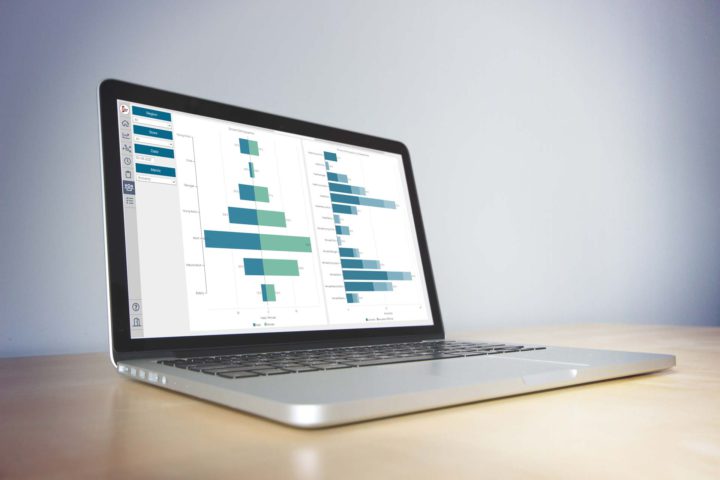
While companies increasingly recognise the importance of data, many are struggling with adoption. Why is building a data culture so tough?


While companies increasingly recognise the importance of data, many are struggling with adoption. Why is building a data culture so tough?

Your organisation likely collects a huge amount of business data. How can you create a data-driven culture to take advantage of it?

Smartphone wifi tracking might seem like the perfect solution for retail foot traffic data, but it's nowhere near as accurate as video. Here's why...
There are many ways to track retail store activity. But not all trackers are created equal. How accurate is your retail foot traffic data?

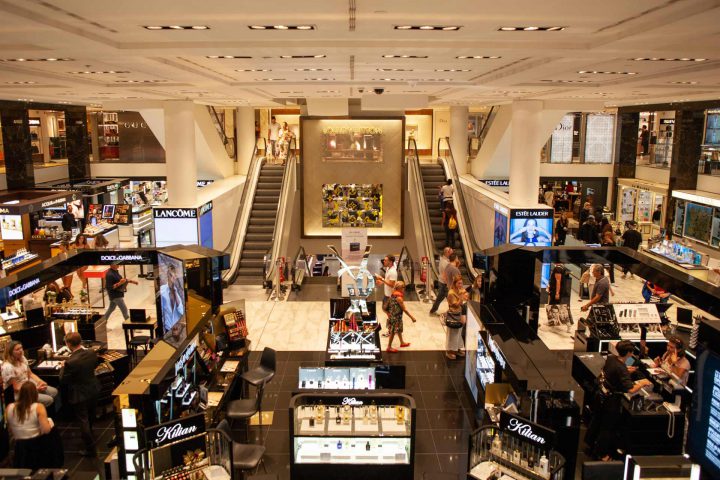
There's no doubt that Aussies love to shop in stores. But after a year like no other, what does the future hold for the store?

Now, more than ever, a comprehensive retail analytics platform (and the right data) is essential to any retail business.
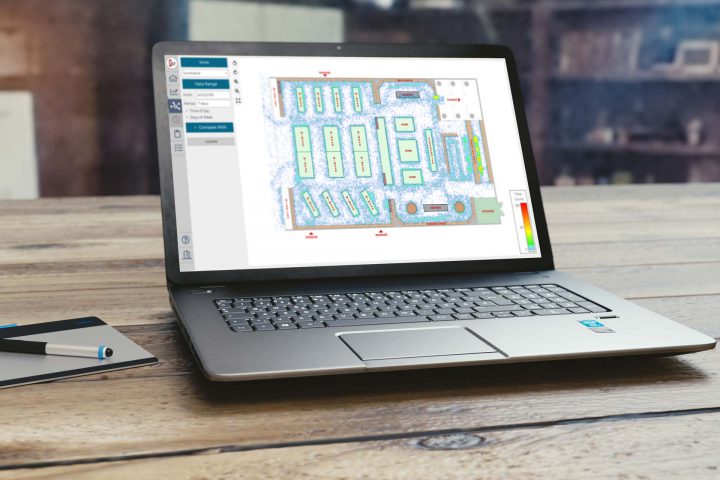
Retail heat maps are a powerful tool for helping bricks and mortar retailers to understand in-store shopper activity, but what are they, and how do they work?

As Melbourne enters another week of its second stage 3 lockdown, how have people's movements changed?
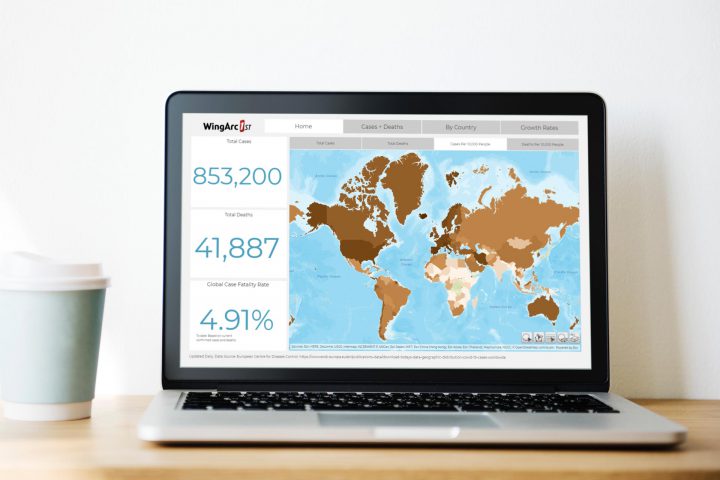
We've built an interactive MotionBoard dashboard to track the COVID-19 pandemic as this ongoing health emergency develops around the world.
If you've ever been involved with online retail, then you’ll know how easy it can be to track the customer’s every move. What if we could do that for bricks and mortar retail?

As a modern retailer, you know understanding your customers is more important today than ever before. But do you know how Retail Video Analytics can help?
The emerging technology of video analytics looks set to be a game changer for bricks and mortar retail, but what exactly is it and how does it work?