
What’s the most dangerous time of the week to be out on the roads? Are they getting safer or more dangerous? Do more accidents happen at low or high speed? The answers might surprise you...
With the rise of Open Data, government agencies around the world are releasing more and more information to the public. But for that data to be truly open, it needs to be released in a way that everyone can use, not just a few statisticians and experts with specialised tools.
Here’s just one example of open data usability issues.
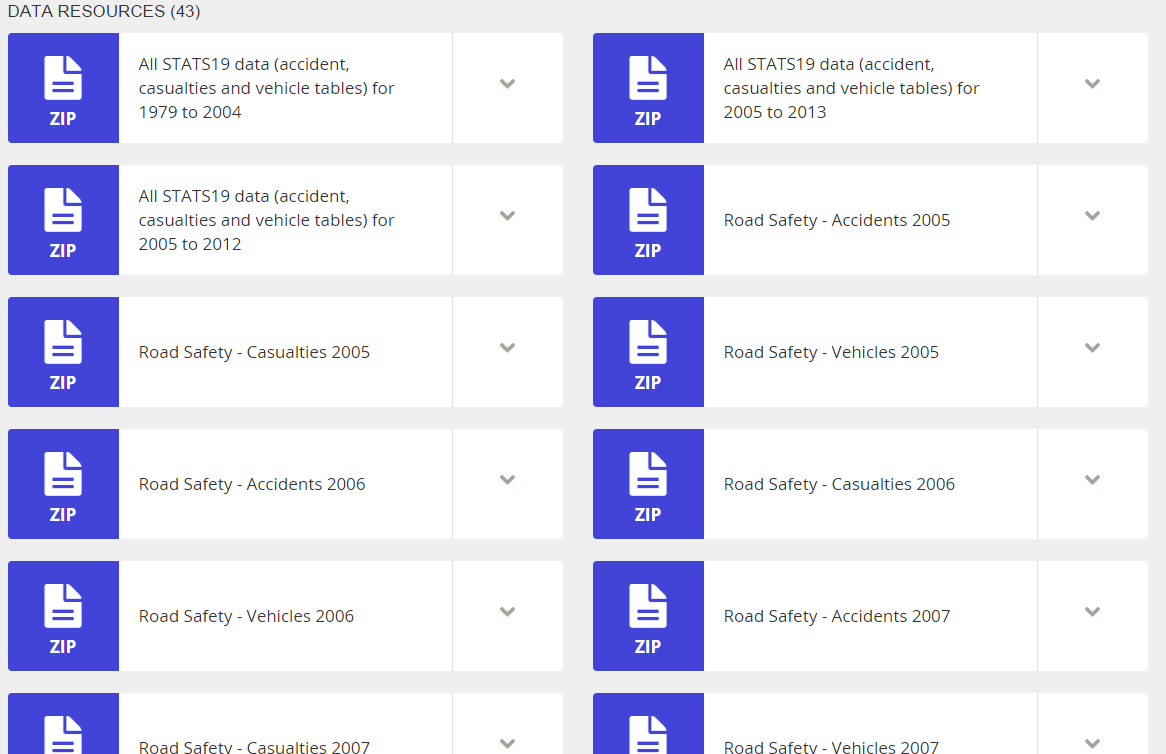
The UK’s Department for Transport offers 35 years of road safety data for download on the data.gov.uk website. These records cover almost 8 million road traffic accidents, including every road fatality in Great Britain since 1979.
While the department is to be commended for making this resource available for anyone to download and use, it is a shame that the data is released as a series of huge CSV files, most of which are too big to open in Excel. Even if you can open these files, if you want to piece together the details, you need to match up a series of codes in one file with their descriptions in another...
In short: while the data is available, it’s really only available to expert statisticians, with specialist knowledge and tools.
The average member of the public would not even know where to start.
A Better Way...
We think there’s a better way.
We developed SuperWEB2 to allow organisations to disseminate data that anyone can use: with our browser-based solution anyone can start answering their own questions just by dragging and dropping the relevant variables onto a table. That’s true open data usability.
To see the difference, we took the department's data and loaded it into the SuperSTAR platform.
We immediately started to see patterns and insights. Here are just five insights we noticed from spending a few minutes with the data in SuperWEB2...
1. British Roads are Getting Safer, at a Remarkable Rate
Whatever the reason, be it safer cars, better roads, or successful anti-drink driving campaigns, British roads today are safer than they have ever been. There's been a dramatic drop in the total number of accidents, particularly since the turn of the century: