
We recently attended the 2014 Higher Education Business Intelligence Conference in Sydney. Here’s our summary of some of the key learning points to remember about the four visions for Business Intelligence.
Vision 1: Cloud Based Access
BI tools such as Tableau and SuperDataHub are making accessibility easier for all. Online access means that data is available in real time whenever and wherever you need it. This is more important than ever because so many of us don’t always work inside the office. Whether you need to be interstate or overseas on business, are working from home or out of the office for any reason, having access to today’s data wherever you are is imperative and makes good business sense. What’s more, storing your data in the Cloud offers huge cost savings! With no infrastructure to manage and seamless integration, the Cloud is making a huge difference to those who have harnessed it.
Key Point: the Cloud is your friend. It’s no secret that some of the world’s largest organisations are taking advantage of the benefits of Cloud computing. In a competitive market, it’s imperative to get the upper hand.
Vision 2: Improve data management to boost productivity
As discussed at the conference by the University of Newcastle, one of their key priorities was to focus on improving data governance.
The first key to good data governance is improving the quality of data. This requires good organisation at the point of collection and managing the data throughout its lifecycle. Data is an extremely valuable business asset and should be viewed and handled that way. Using a model such as the “General Statistical Business Process Model” (GSBPM) makes it possible for organisations to manage and share metadata throughout its lifecycle via a structured and proven process. This model was developed by international statistics organisation UNECE in conjunction with Eurostat and the OECD in order to create a standard terminology and define an internationally accepted set of business processes needed to produce official statistics. As a framework for enterprise, it has proven to be the best way to collect, analyse and share information.
The second key is to eliminate human error. Human error is often to blame for poor data and many organisations have discovered one key to improving data quality is the removal of repetitive processes and providing a “program free” environment. In this way staff can better handle the tasks at hand without making the common mistakes of a missed column or an extra zero that just broke the budget. A user-friendly interface will also reduce human error simply by being easy to use. If no special training is required then staff can proceed with confidence knowing they have the capability to complete the task at hand. It’s a proven fact that productivity increases as tasks are made simpler.
Key Points: Implement a data management regime such as GSBPM to oversee the nine stages of data management from its initial planning stage right through to evaluation.
Secondly, remember the well-known IT acronym KISS, or ‘Keep It Simple Stupid’. A simpler user-interface will result in better quality data, and better quality data will lead you to a clear understanding of your data…which leads us to vision three.
Vision 3: Better Data Analysis
Data scientists have been a necessary part of the data analysis process due to their skill at finding patterns in data. With the ability to now visualise data using BI tools, anyone can find the correlations in the data and reveal patterns which would otherwise remain hidden to the untrained eye. You don’t have to be a data scientist if you have the right BI tools at your fingertips. Looking at data through the lenses of a program such as SuperCROSS allows you to visualize trends by highlighting the areas needing attention.
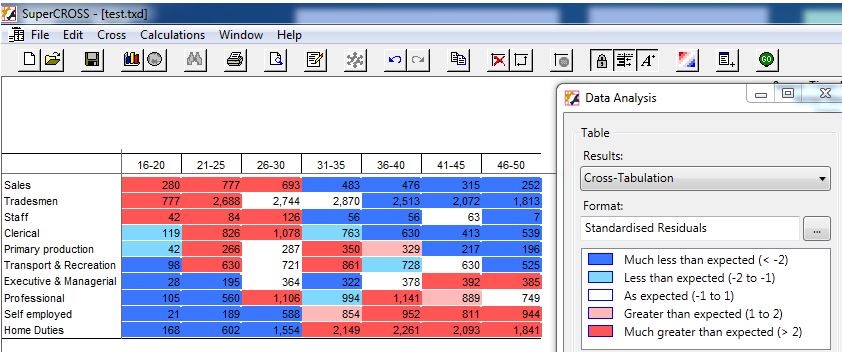
Key Point: When using a program like SuperCROSS you do not need specialist staff to understand the data. The right BI tools will highlight what staff need to focus on and this new found understanding of the data will lead to better decision making.
Vision 4: Forecasting
The trend in business is that competition is increasing from both international and domestic competitors. This is why forecasting, planning and budgeting are essential to the successful growth of any organisation. In the education space, for example, the right Business Intelligence solution can provide a forecasting tool for future student load, course demand and commercial viability. A good BI tool should have a set of inbuilt statistical functions that make it easy to perform statistical analysis without the need of trained professionals. The statistical functions available in SuperCROSS include:
- Exponential function
- Logarithm function
- Round function
- Square root function
- Median Value function
- Percentile function
- Pareto index function
- Mean function
- Variance function
- Standard deviation function
- Asymmetry function
- Skewness function
- Forecasting function
The forecasting feature allows you to predict future values based on past data. For example, you can use forecasting to answer the question: “what will be next year’s student loads, based on student loads for the last 10 years?
The forecast is added into the table using the ‘derivation’ functionality. You don’t need to program in SuperCROSS, using the Statistical Functions section, simply select ‘Forecast’ and the algorithm will automatically be applied to the derivation.
We can also use geographic capabilities to provide forecasting over maps. This could be used to provide lead indicators for student retention or even targeting for international students i.e. when should we target specific markets overseas?
Key Point: Your BI tool should have statistical capabilities. The need for statistical knowledge and ‘know-how’ has never been greater. The right BI tool should empower all users to find hidden gems in the data and propel the decision making processes. Let true statistics drive your business.
Most important: Your BI tools should be working for you and making it easier to arrive at the right conclusions and uncover the hidden story your data has to tell.
Talk to Space-Time Research about a solution that is right for you.