Skip to content
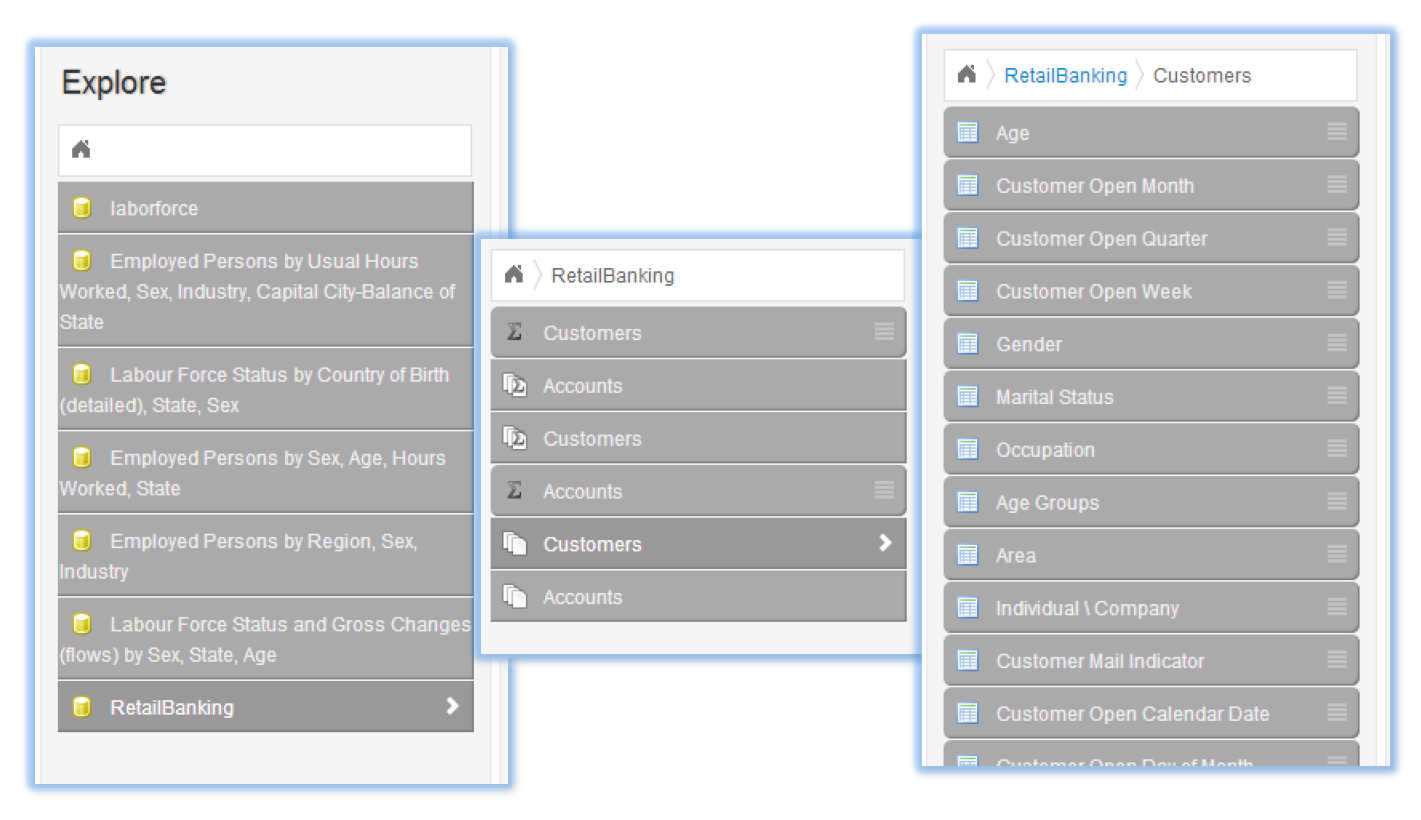
Explore
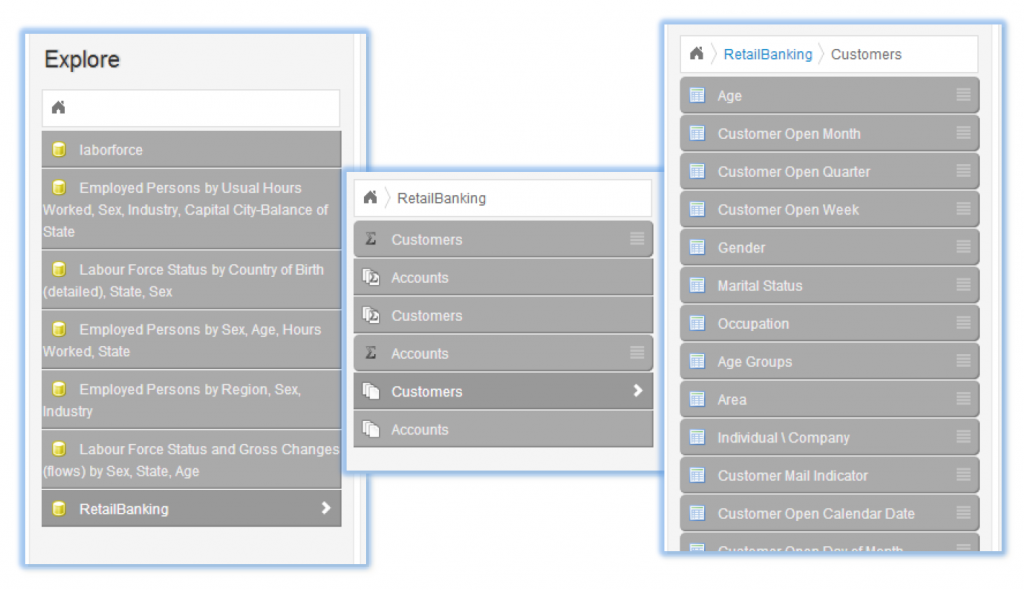
- Firstly, pick which data set you want
- Expanding menus make this very easy
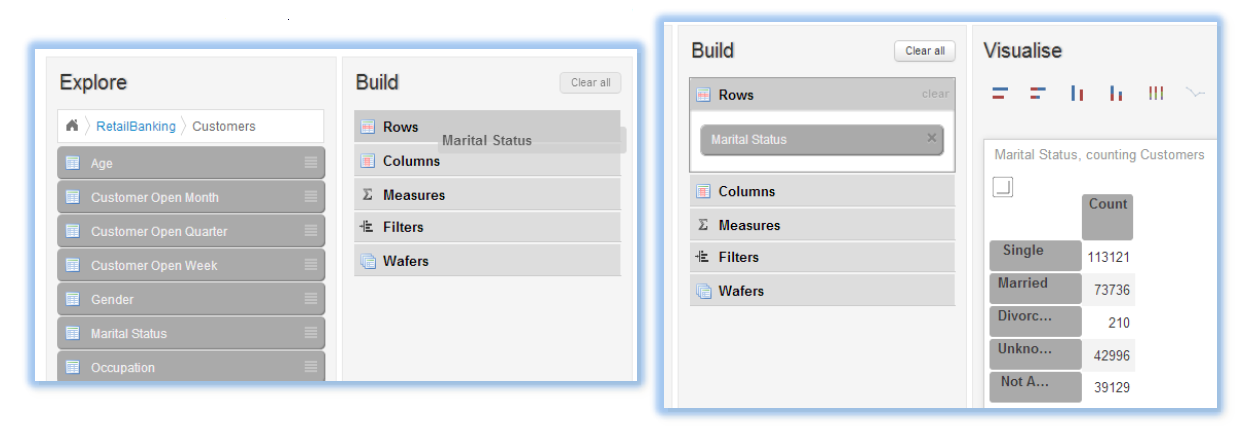
Build (Query and Subset)
- Simply drag and drop values onto the Rows and Columns areas. A Row first in this example
- Note how SuperDataHub automatically creates and populates the output (Visualise) table as you go
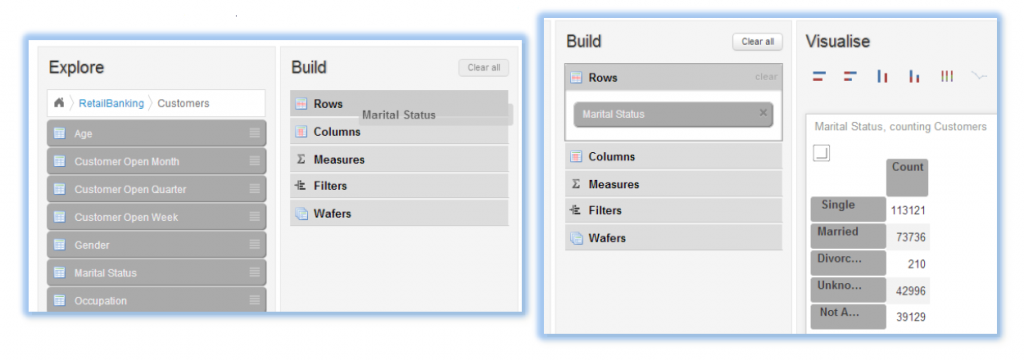

- And again, the output is quickly and automatically updated
Visualise
- You can expand the default table visualisation if you want
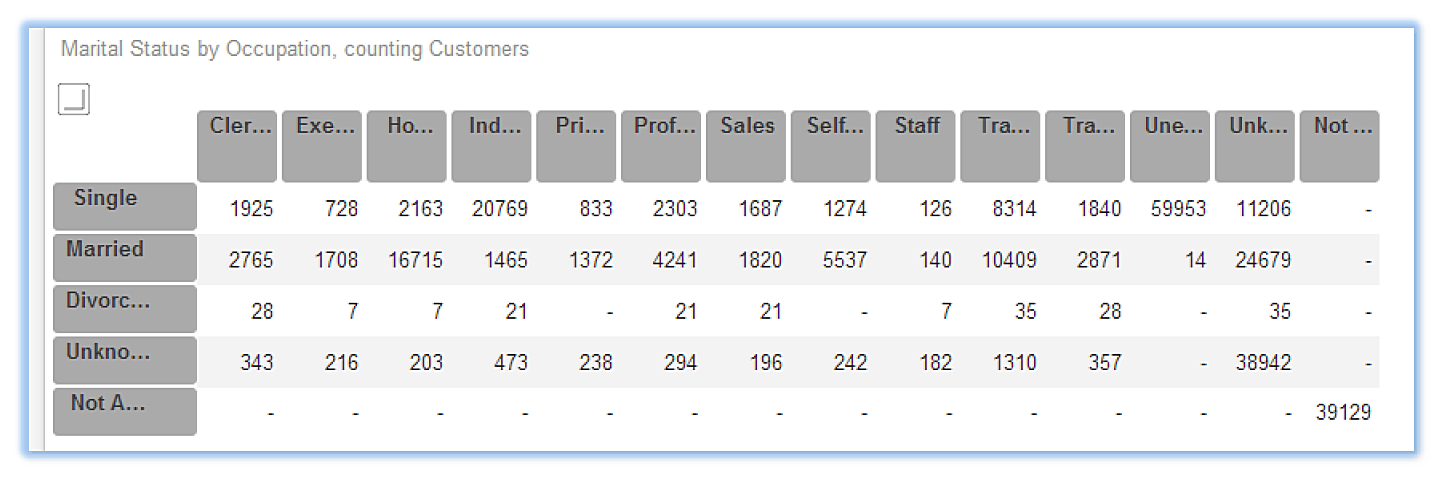
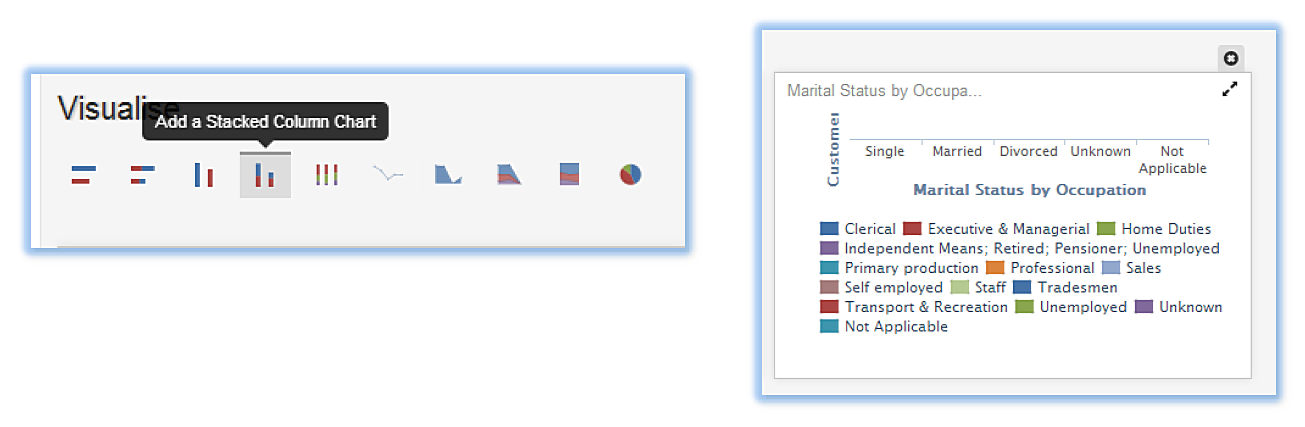
- Or create a chart:

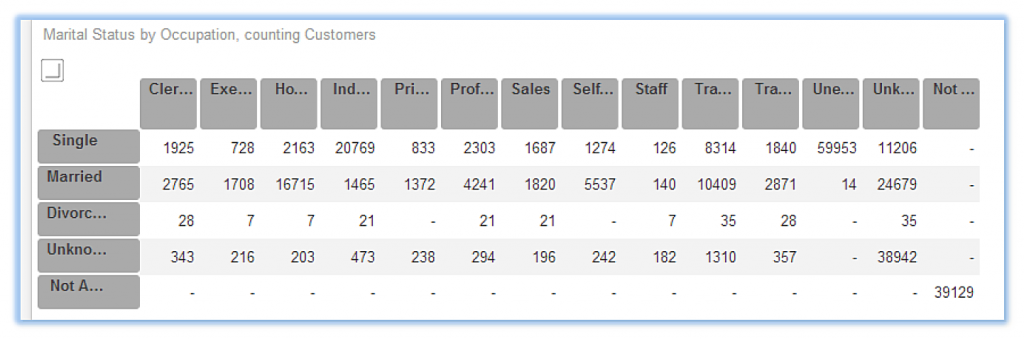
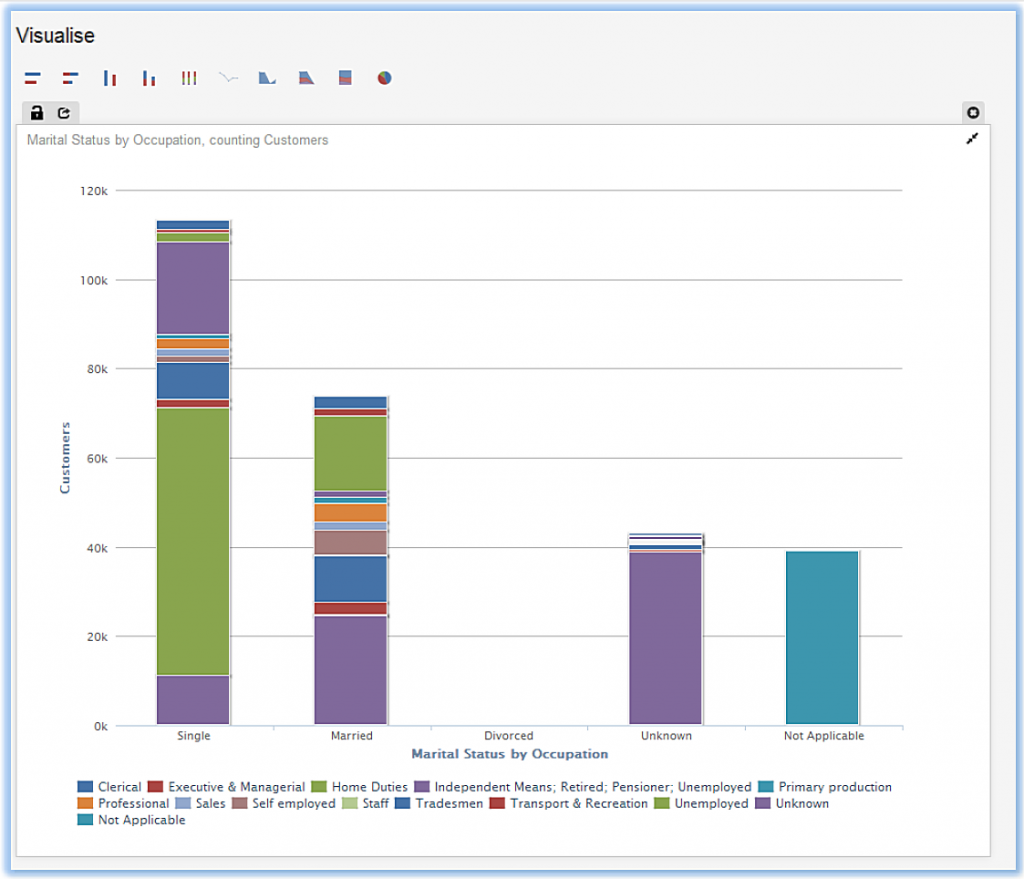
- There’s a lot of data, so we can easily expand our chart with one click:
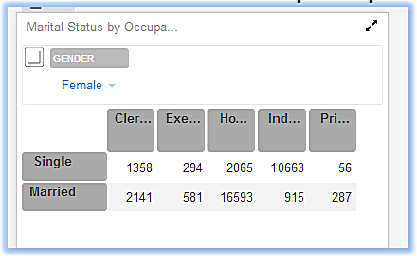
Wafers
- Time to do some ‘slicing’! We’ll drag and drop a value (Gender) onto the Wafer area. Note how the Visualise output automatically updates:
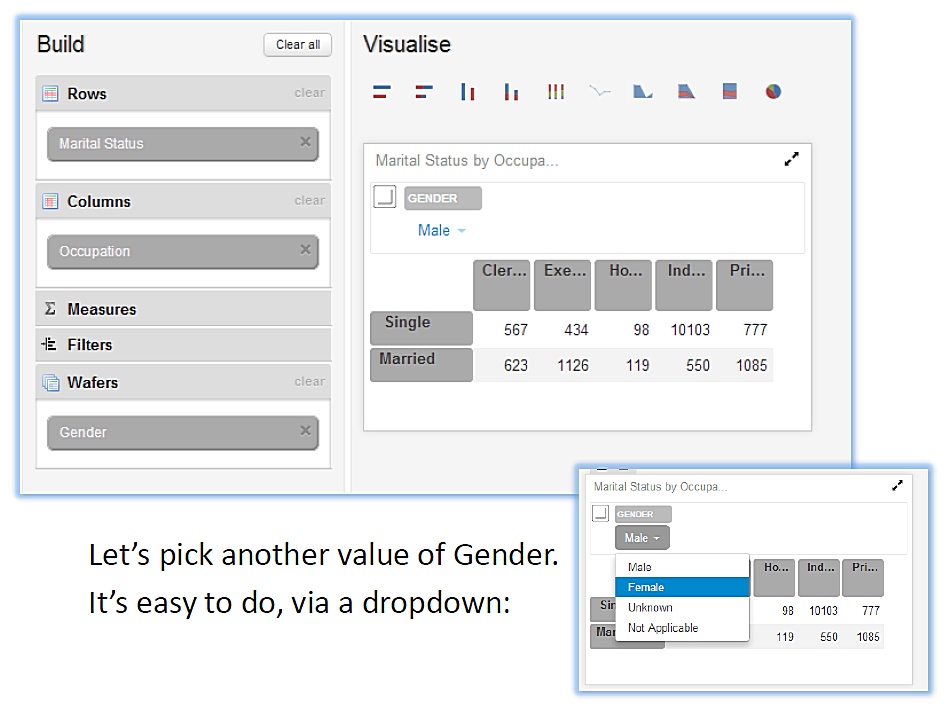
- Once selected, our output updates with the new values: